How to Use Technical Analysis for Crypto Trading
In this article, we’ll explore how to use technical analysis for crypto trading, breaking down the concept in detail to help you make informed trading decisions.
Cryptocurrency trading has become increasingly popular over the years, with millions of traders worldwide trying to capitalize on the volatile nature of digital assets. While fundamental analysis focuses on the intrinsic value of a cryptocurrency, technical analysis (TA) is a method used to predict future price movements based on historical data, charts, and indicators. In this article, we’ll explore how to use technical analysis for crypto trading, breaking down each concept in detail to help you make informed trading decisions.
What is Technical Analysis?
Technical analysis is a trading discipline that evaluates investments and identifies trading opportunities by analyzing statistical trends gathered from trading activity, such as price movement and volume. Unlike fundamental analysis, which looks at a cryptocurrency’s underlying value, technical analysis focuses on patterns and trends in price charts to predict future movements.
In the crypto market, where prices can swing dramatically within minutes, technical analysis is a valuable tool for traders. It helps them navigate the market’s volatility and make data-driven decisions.
Key Principles of Technical Analysis
Before diving into the tools and techniques, it’s essential to understand the foundational principles of technical analysis:
- Price Discounts Everything: This principle assumes that all known information—news, market sentiment, and fundamentals—is already reflected in the price of a cryptocurrency.
- Price Moves in Trends: Crypto prices tend to move in trends, which can be upward (bullish), downward (bearish), or sideways (neutral).
- History tends to repeat itself: Human psychology drives market behavior, and patterns in price movements often repeat over time.
With these principles in mind, let’s explore how to apply technical analysis to crypto trading.
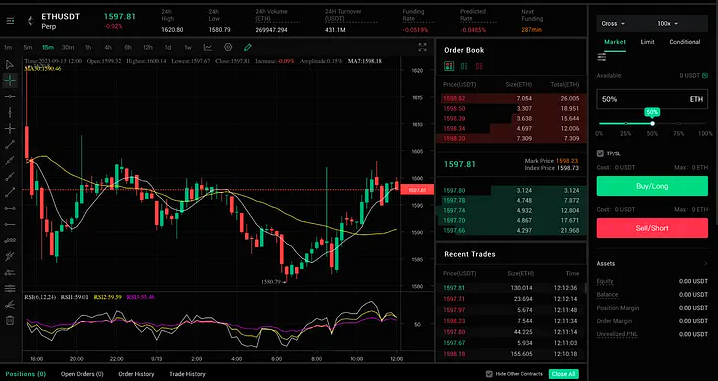
Step 1: Understand the Basics of Crypto Charts
The foundation of technical analysis is the price chart. Crypto charts display the price movement of a cryptocurrency over a specific period. The most common types of charts are:
- Line Charts: A simple chart that connects closing prices over time.
- Candlestick Charts: A more detailed chart that shows the open, high, low, and close prices for a specific time frame.
- Bar Charts: Similar to candlestick charts but represented by vertical bars.
Candlestick charts are the most popular among crypto traders because they provide more information about price action and market sentiment.
Step 2: Identify Support and Resistance Levels
Support and resistance levels are crucial concepts in technical analysis. They represent price levels where the market has historically shown a tendency to reverse or stall.
- Support Level: A price level where buying pressure is strong enough to prevent the price from falling further. It acts as the “floor” for the price.
- Resistance Level: A price level where selling pressure is strong enough to prevent the price from rising further. It acts as a “ceiling” for the price.
For example, if Bitcoin has repeatedly bounced off the 30,000 level, that level is considered strong support.Conversely,ifitstrugglestobreakabove40,000, that level is a resistance.
Traders use these levels to make decisions. For instance, buying near support and selling near resistance can be profitable strategies.
Step 3: Use Trend Lines to Spot Trends
Trend lines are diagonal lines drawn on a chart to connect a series of highs or lows. They help traders identify the direction of the market trend.
- Uptrend Line: Drawn by connecting higher lows, indicating a bullish trend.
- Downtrend Line: Drawn by connecting lower highs, indicating a bearish trend.
- Sideways Trend: When the price moves horizontally, indicating a lack of clear direction.
Trend lines can also act as dynamic support or resistance. For example, in an uptrend, the trend line often acts as support, and traders may look to buy when the price touches the line.
Step 4: Master Key Technical Indicators
Technical indicators are mathematical calculations based on price, volume, or open interest. They help traders analyze market conditions and predict future price movements. Here are some of the most popular indicators used in crypto trading:
1. Moving Averages (MA)
Moving averages smooth out price data to identify trends. The two most common types are:
- Simple Moving Average (SMA): The average price over a specific period.
- Exponential Moving Average (EMA): Gives more weight to recent prices, making it more responsive to new information.
Traders often use moving averages to identify support and resistance levels or to confirm trends. For example, if the price is above the 200-day SMA, it’s considered a bullish signal.
2. Relative Strength Index (RSI)
The RSI is a momentum oscillator that measures the speed and change of price movements. It ranges from 0 to 100 and is used to identify overbought or oversold conditions.
- Overbought (RSI > 70): indicates a potential price correction or reversal to the downside.
- Oversold (RSI < 30): indicates a potential price bounce or reversal to the upside.
3. Moving Average Convergence Divergence (MACD)
The MACD is a trend-following momentum indicator that shows the relationship between two moving averages. It consists of:
- MACD Line: The difference between the 12-day and 26-day EMA.
- Signal Line: The 9-day EMA of the MACD line.
- Histogram: The difference between the MACD line and the signal line.
Traders look for crossovers between the MACD line and the signal line to identify buy or sell signals.
4. Bollinger Bands
Bollinger Bands consist of a middle band (SMA) and two outer bands (standard deviations away from the SMA). They help traders identify volatility and potential price reversals.
- When the bands widen, it indicates increased volatility.
- When the bands narrow, it indicates decreased volatility.
Step 5: Recognize Chart Patterns
Chart patterns are formations that appear on price charts and provide insights into potential future price movements. Some common patterns include:
1. Head and Shoulders
This pattern consists of three peaks, with the middle peak (head) being the highest and the two outside peaks (shoulders) being lower. It signals a potential trend reversal from bullish to bearish.
2. Double Top and Double Bottom
- Double Top: Two peaks at approximately the same price level, indicating a potential reversal from bullish to bearish.
- Double Bottom: Two troughs at approximately the same price level, indicating a potential reversal from bearish to bullish.
3. Triangles
Triangles are continuation patterns that indicate a period of consolidation before the price breaks out.
- Ascending Triangle: A bullish pattern characterized by a flat resistance line and a rising support line.
- Descending Triangle: A bearish pattern characterized by a flat support line and a falling resistance line.
- Symmetrical Triangle: A neutral pattern where the price converges between two trend lines.
Step 6: Incorporate Volume Analysis
Volume is a critical component of technical analysis. It measures the number of coins traded during a specific period and helps confirm the strength of a price movement.
- High Volume: Indicates strong interest in a cryptocurrency, confirming the validity of a price movement.
- Low Volume: suggests weak interest, indicating a potential reversal or lack of momentum.
For example, if the price breaks above a resistance level with high volume, it’s a strong bullish signal. Conversely, if the price breaks below a support level with low volume, it may be a false breakout.
Step 7: Develop a Trading Strategy
Once you’ve mastered the tools and techniques, the next step is to develop a trading strategy. A good strategy should include:
- Entry Points: When to enter a trade (e.g., when the RSI is oversold).
- Exit Points: When to exit a trade (e.g., when the price reaches a resistance level).
- Risk Management: How much to risk on each trade (e.g., no more than 2% of your portfolio).
Backtesting your strategy on historical data can help you evaluate its effectiveness before applying it to live trading.
Step 8: Stay Updated and Adapt
The crypto market is highly dynamic, and what works today may not work tomorrow. Stay updated on market news, technological developments, and changes in market sentiment. Additionally, be prepared to adapt your strategy as market conditions evolve.
Common Mistakes to Avoid in Crypto Technical Analysis
- Overloading Charts with Indicators: Using too many indicators can lead to analysis paralysis. Stick to a few that you understand well.
- Ignoring Fundamentals: While technical analysis is powerful, ignoring fundamental factors like news and regulations can be risky.
- Emotional Trading: Letting emotions dictate your trades can lead to poor decisions. Stick to your strategy and avoid FOMO (fear of missing out).
Conclusion
Technical analysis is an essential skill for crypto traders looking to navigate the volatile and unpredictable cryptocurrency market. By understanding chart patterns, key indicators, and market trends, you can make informed trading decisions and improve your chances of success. However, remember that no strategy is foolproof, and risk management is crucial to long-term profitability. Start small, practice consistently, and continuously refine your approach to become a proficient crypto trader.